This report named ‘The state of online retail performance’ (original SOASTA’s page speed research) is the most valuable study on page load time that has been done in past few years. The company had a few questions to find answers on:
- What is the optimal page load time that provides the highest conversion rate?
- What is the impact of 1 sec of performance slowdown (or improvement) on a website conversion rate and bounce rate?
- What are the user behavior and reaction to site slowing down depending on device type?
The researchers gathered and analyzed a huge amount of data from leading websites – the study takes into account more than 10 billion customer visits totally. So this gives us a reason to trust the data obtained as a result of that research. Researchers have made many conclusions regarding the website speed. We bring to your attention only the most significant of them.
TOP of Findings
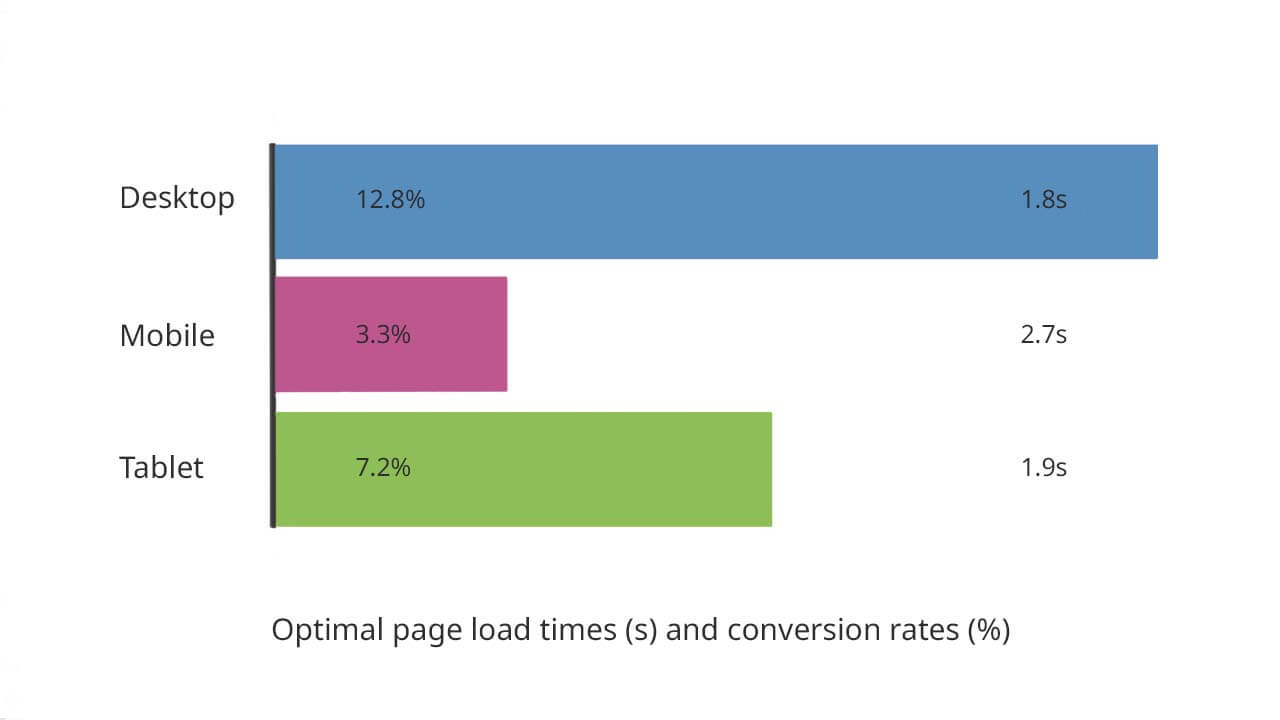
▣ Optimal page load time is in the range of 1.8 to 2.7 seconds
Does this mean that a time of 1.8 seconds is a “fast enough” page speed for desktops? No. It means that if you continue to make your website’s pages faster, you will see payback – conversion rate increasing. It is the same for other devices – it would be excellent if your page load time for mobiles is 2.7 seconds and 1.9 seconds for tablets.
▣ Even 100ms delays impact on conversion rates
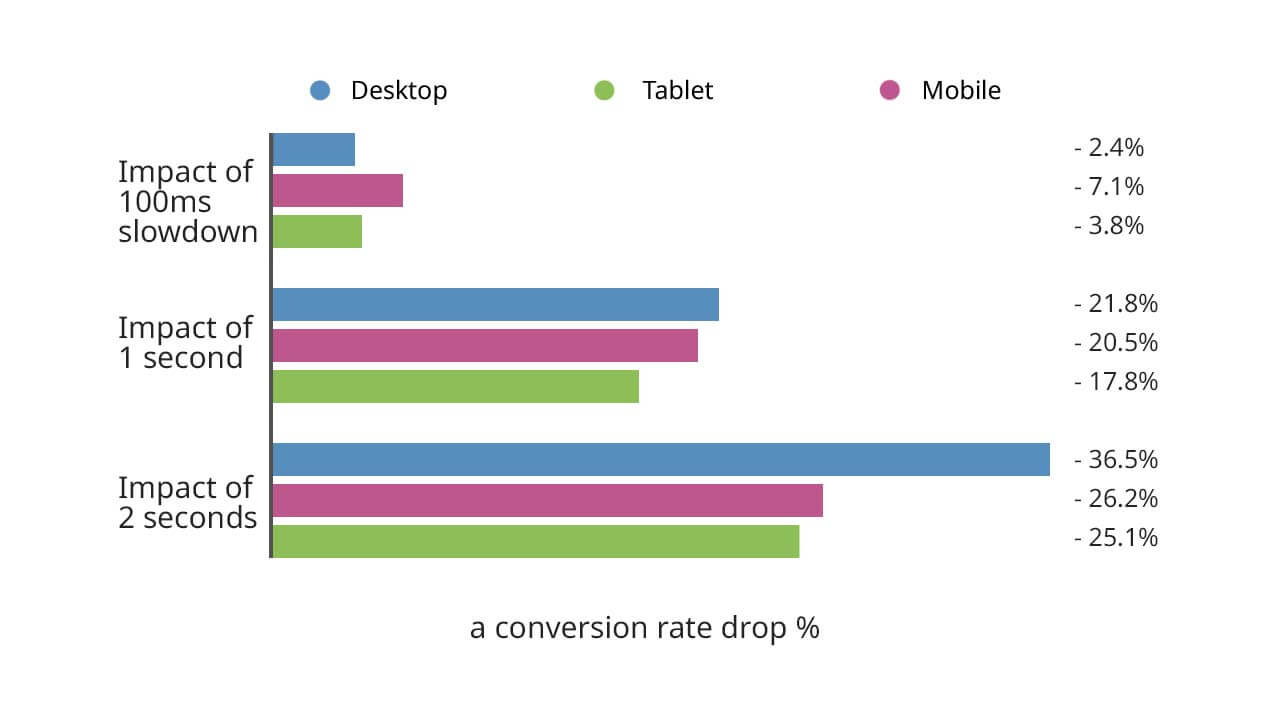
Many pages that loaded slower than 1.8 seconds on desktops experienced a decrease in conversion rate. It may sound weird, but even 100ms play a role. Just think: you only have time to blink in such a short time. But the conversion rate of your site decreased by 2.4%.
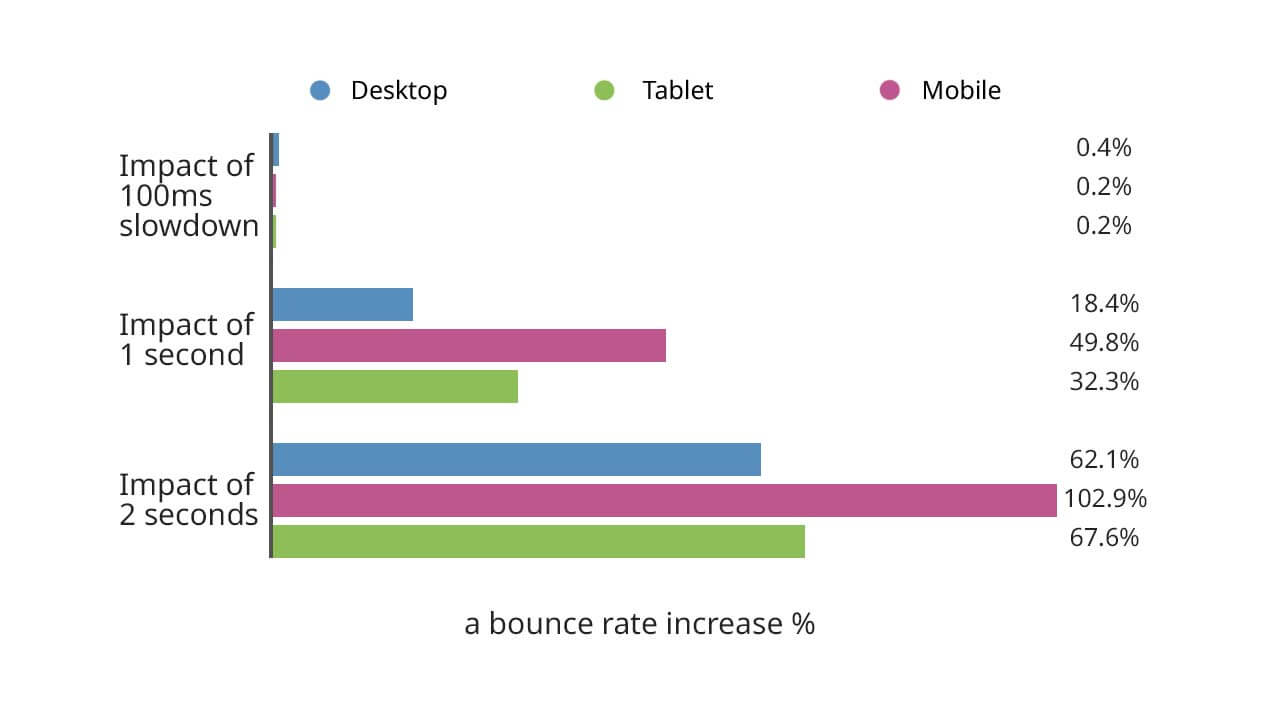
▣ 2-second delay causes 60 – 103% hurt on bounce rates
In a case with bounce rates, 100ms does not play a significant role. 1-2 seconds delays after the optimal page load time have a noticeable effect on bounce rates.
▣ 2-second slowdown correlated with a 38 – 51% decrease in user session length
Fast web-pages stimulate customers to spend more time on your site and do more activities there. A session length is an important indicator of user satisfaction and engagement: how many pages were visited at once.
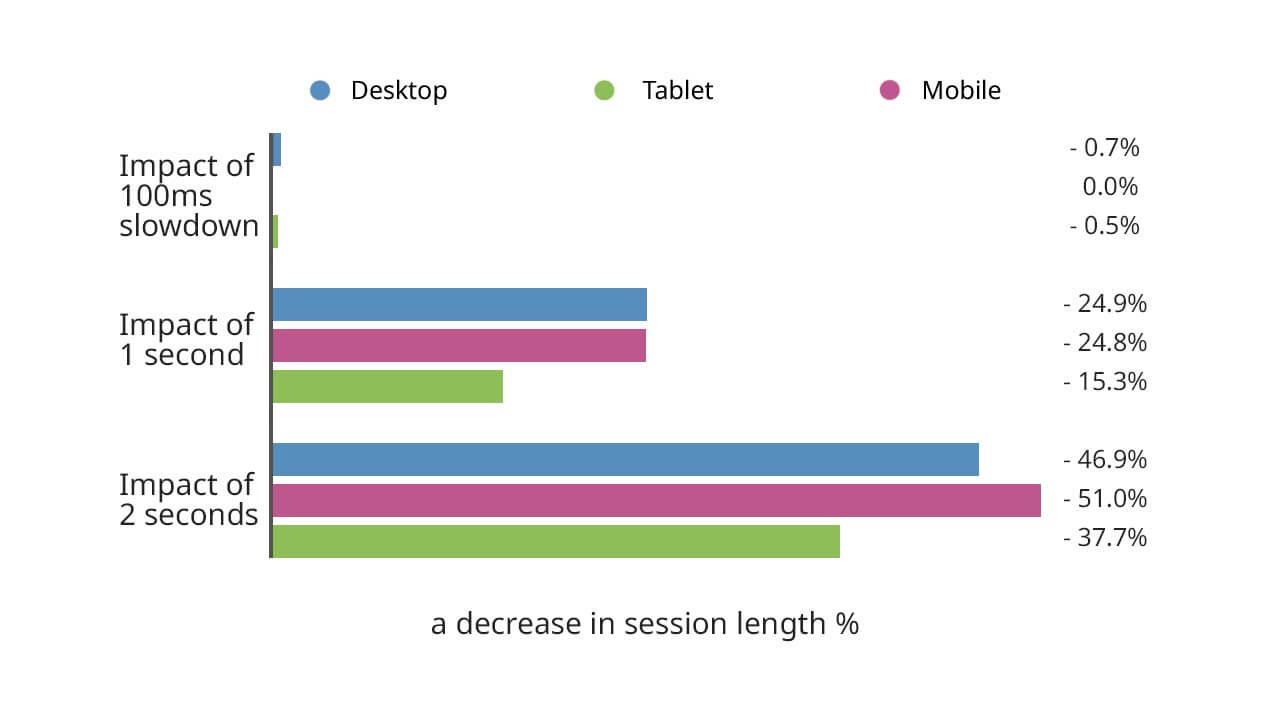
▣ Visitors react differently on desktops, tablets and android mobiles.
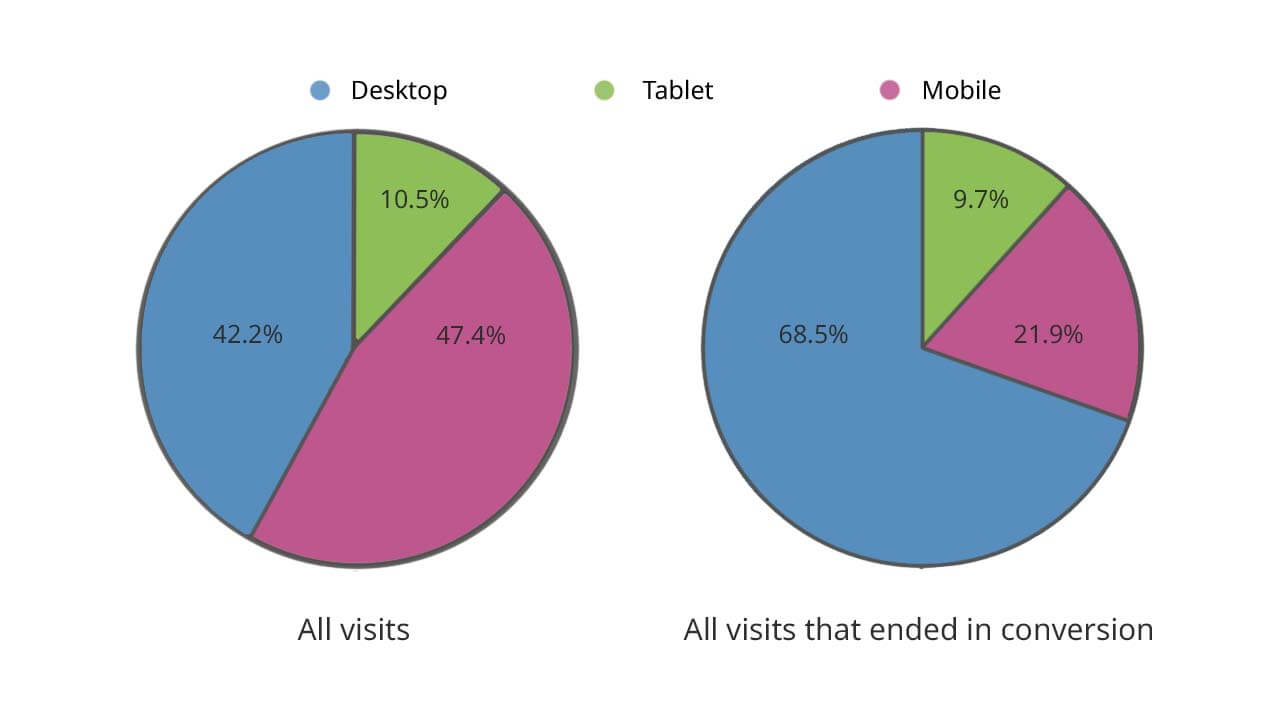
According that Soasta (Akamai) research, almost half of traffic (47%) comes from mobiles, but surprisingly only 22% of conversions happen on mobile devices. Long page load time has a greater negative influence on desktop users. People who prefer mobile devices are more sensitive to delays in terms of bounce rate. As you can see, only tablet users seem to be the most patient.
